Below you can find a collection of dashboards created with gyule.io using data imported from Google Sheets.
These examples show how gyule.io can be adapted to different use cases and industries, such as SaaS, ecommerce, finance, and more. Each dashboard is built from simple spreadsheet data and transformed into clear, visual reports to monitor performance, trends, and key metrics.
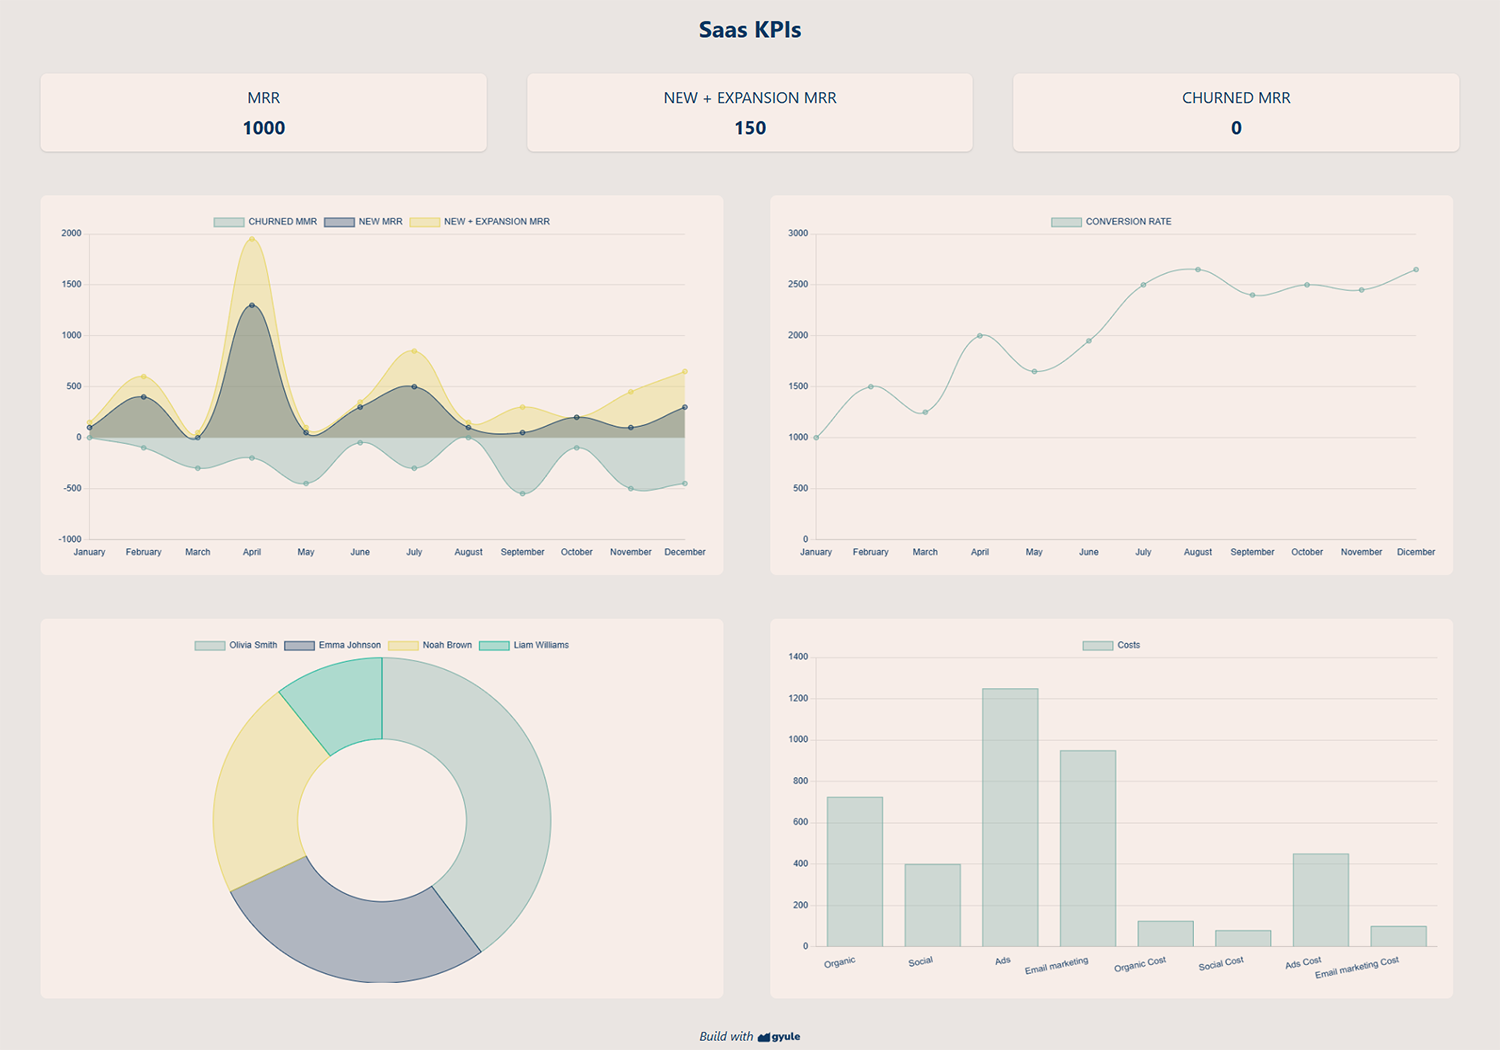
A dashboard tracking key SaaS metrics like MRR, churn rate, and customer acquisition costs.
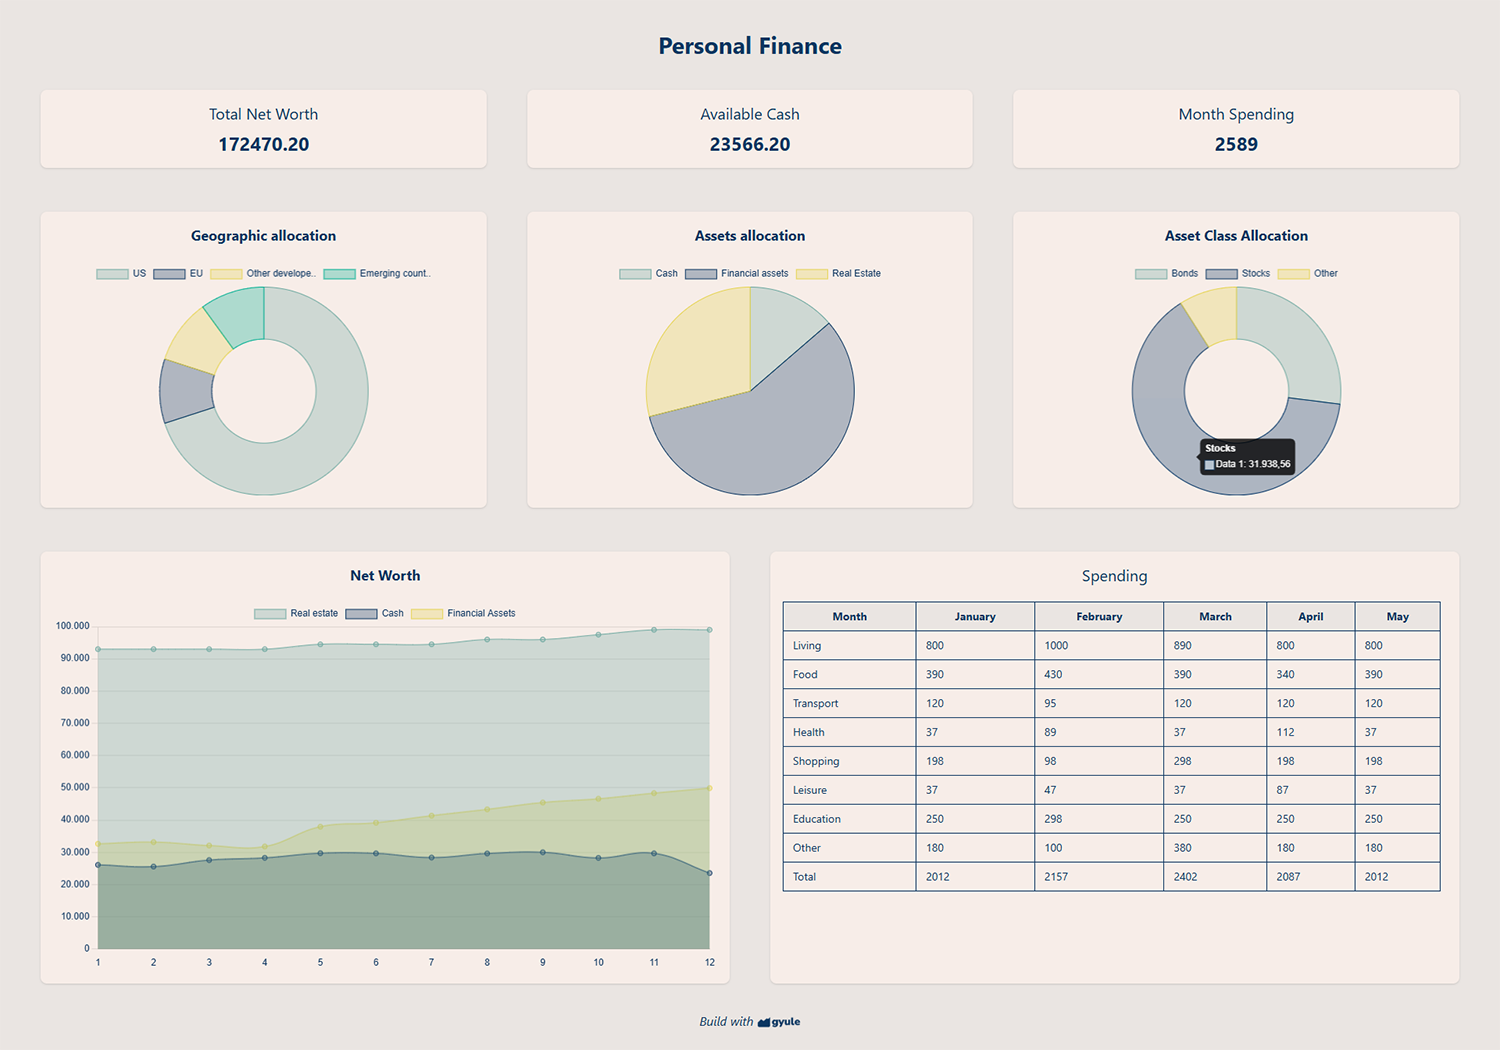
An interactive dashboard that visualizes portfolio allocation and spending patterns across asset classes and categories. Built to support informed financial decision-making.
A simple habit tracker dashboard to monitor daily progress and build consistent routines over time.
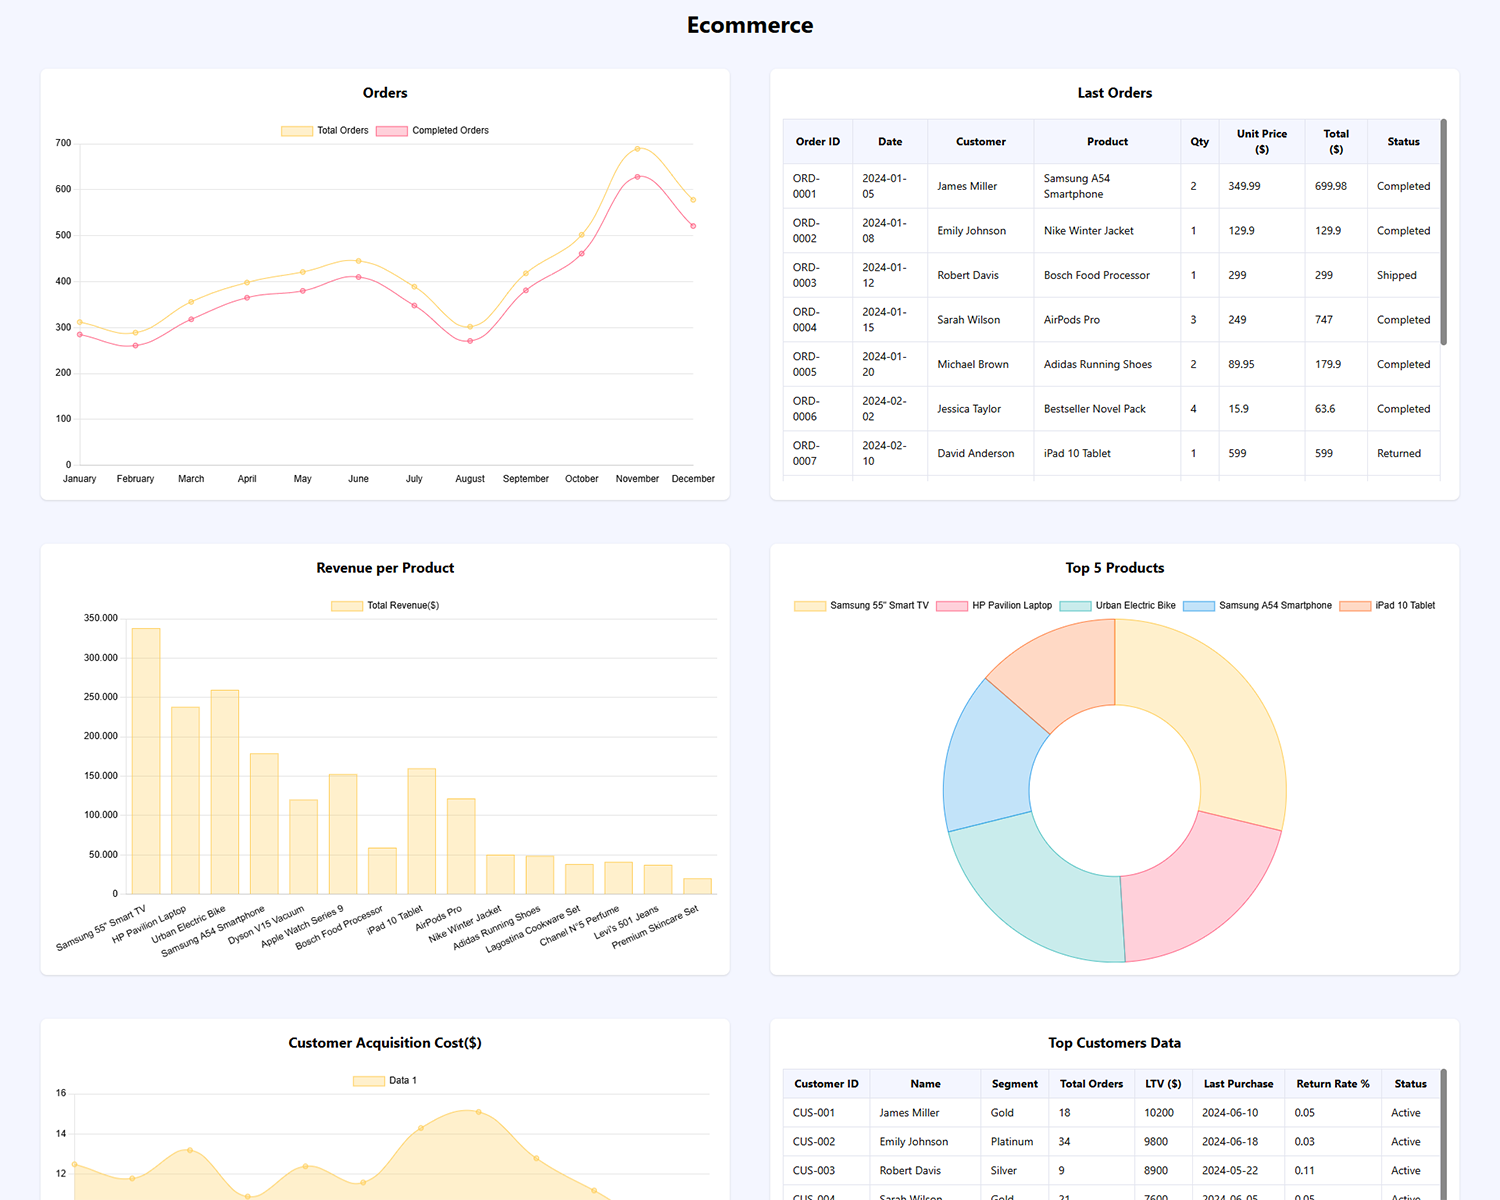
A visual dashboard designed to track sales, revenue, and customer insights at a glance.